Time to read:
Multicast is one of those networking concepts that most engineers learn early in their careers. Instead of sending identical data streams individually to every receiver, multicast allows a single stream to be distributed efficiently to many devices that join a specific group.
Recently, the team at Packet Pushers explored this topic in an episode of the N Is For Networking podcast, breaking down the fundamentals of multicast and why it still plays an important role in modern networks.
From IPTV and surveillance systems to financial data feeds and large-scale enterprise video distribution, multicast remains one of the most efficient ways to deliver the same data stream to many endpoints.
But while multicast is efficient in theory, operating multicast networks in the real world can present unique challenges.
Multicast Is Efficient, But Harder to Troubleshoot
Unlike traditional unicast traffic, multicast relies on group memberships, dynamic routing trees, and packet replication across network devices.
When something breaks, engineers often need to answer questions like:
- Did receivers successfully join the multicast group?
- Is multicast traffic actually reaching the expected network segments?
- Are replication points creating unexpected bandwidth spikes?
- Is congestion occurring somewhere along the distribution path?
Because multicast traffic can traverse multiple routers and replication points, diagnosing problems often requires strong visibility into how traffic is flowing across the network infrastructure.
The Visibility Problem
Many monitoring platforms collect interface statistics every five or ten minutes. While that may work for basic capacity planning, it often misses the short bursts of traffic that can disrupt multicast streams.
Video distribution, market data feeds, and other multicast workloads can generate sudden spikes in bandwidth utilization that last only seconds.
If those events fall between polling intervals, they may never appear in monitoring data… making troubleshooting far more difficult.
For network teams investigating intermittent issues, this lack of visibility can turn troubleshooting into guesswork.
Where Monitoring Makes the Difference
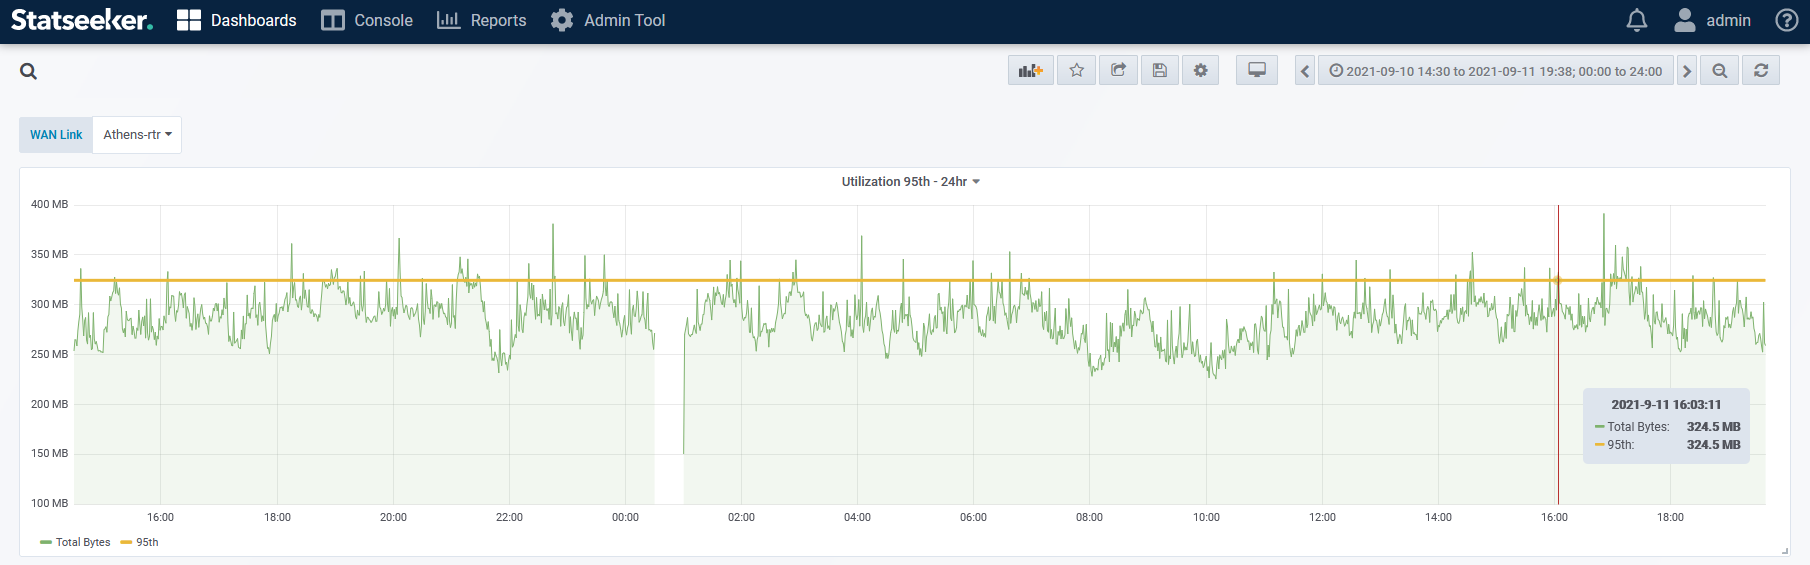
Understanding multicast performance often begins with understanding what’s happening at the interface level.
Statseeker collects network performance data across the entire infrastructure every 60 seconds via SNMP, providing granular visibility into interface utilization, packet rates, and multicast packet counters (when devices expose them).
While Statseeker does not analyze multicast streams directly like packet capture or NetFlow tools, these interface counters and historical metrics can help engineers identify unusual multicast traffic patterns across the network.
This allows engineers to quickly identify:
- Interfaces experiencing unexpected traffic spikes
- Network segments carrying elevated multicast packet rates
- Multicast flooding caused by IGMP or VLAN misconfiguration
- Congestion or packet-rate spikes impacting streaming applications
- Historical trends that help explain when network behavior changed
Because Statseeker retains historical data, engineers can investigate when multicast traffic patterns changed and where they occurred in the network.
Customers also use Statseeker’s user-initiated troubleshooting tool, the 1-second poller, to help identify congestion issues, as the polling frequency is very high.
Network jitter values can also provide additional context during troubleshooting. While average latency alone may not always indicate congestion, larger variations in jitter can indicate congestion occurring in the network.
Learn More
If you’d like a refresher on how multicast works and why it still matters in modern networks, the N Is For Networking podcast episode on multicast fundamentals from Packet Pushers is a great place to start.
And if you’re responsible for operating networks where multicast traffic matters, having the right level of network visibility can make the difference between guessing and knowing what actually happened.
Curious how engineers use Statseeker to investigate network performance issues?
Request a demo or start a free trial to see how high-frequency polling and detailed historical data provide deeper visibility across your entire network.